

Description
What you get
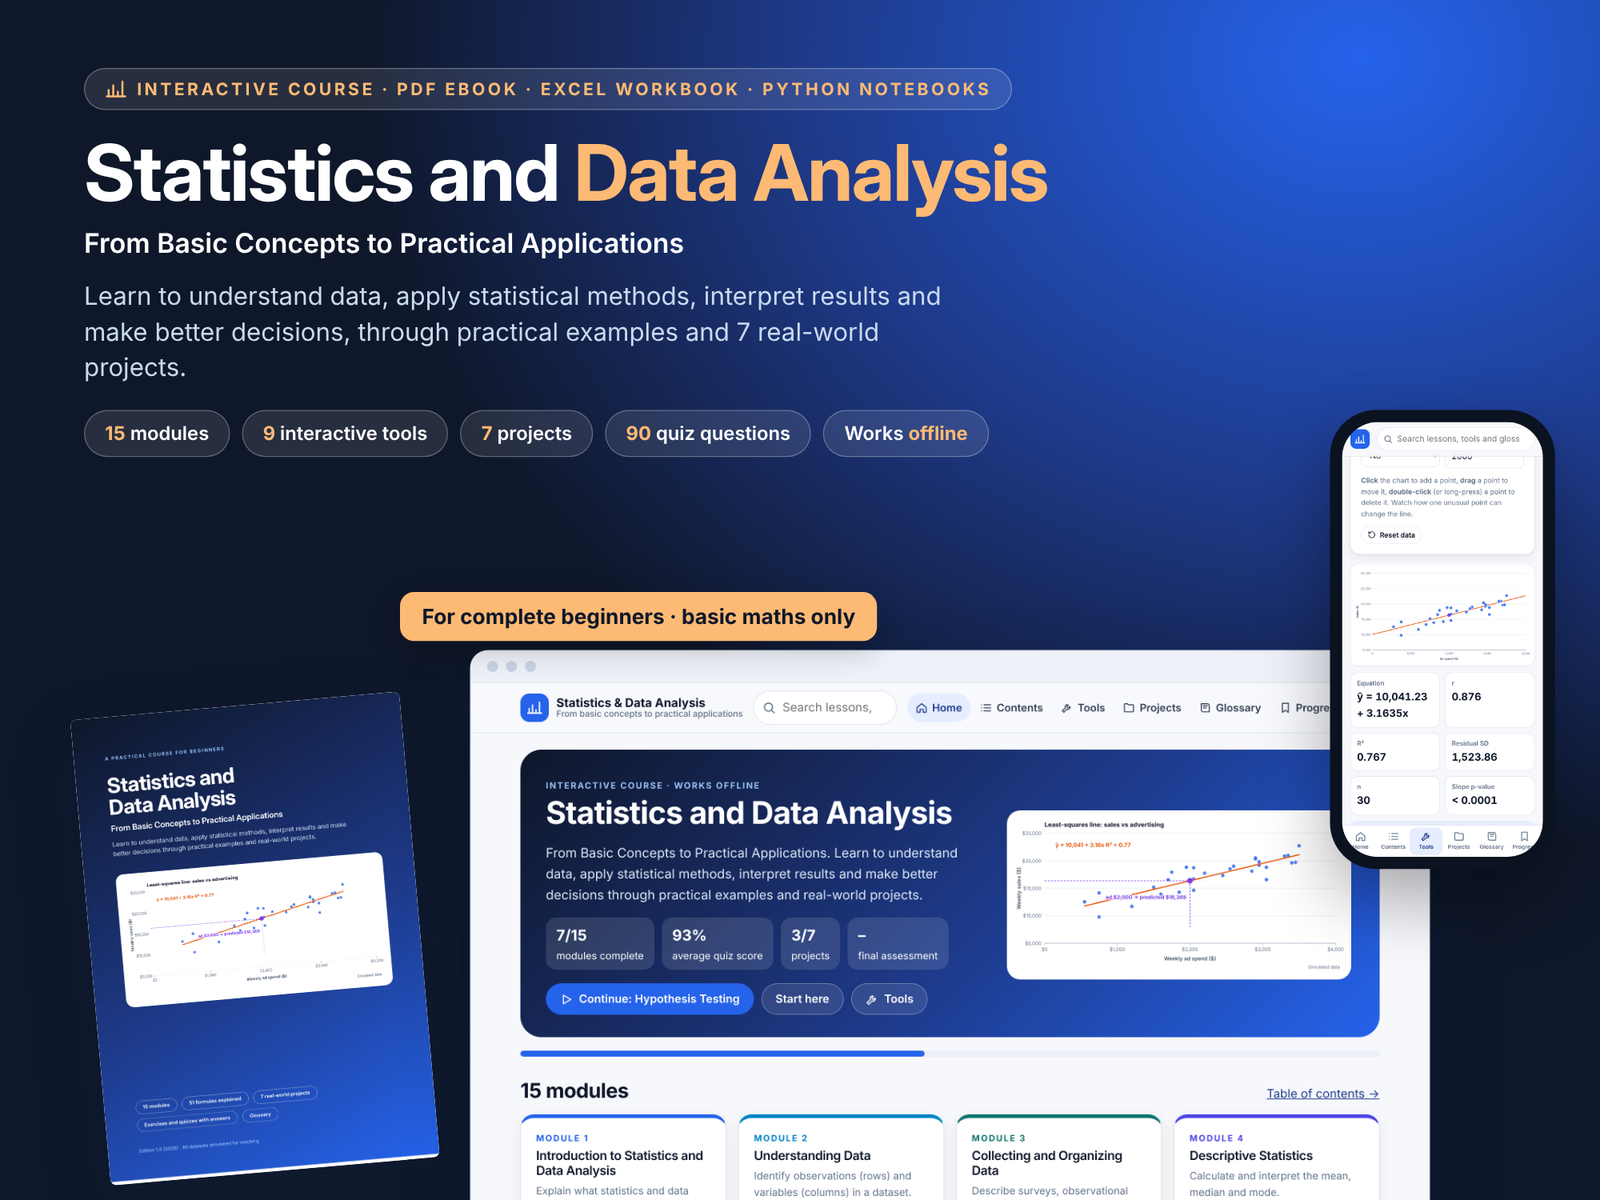
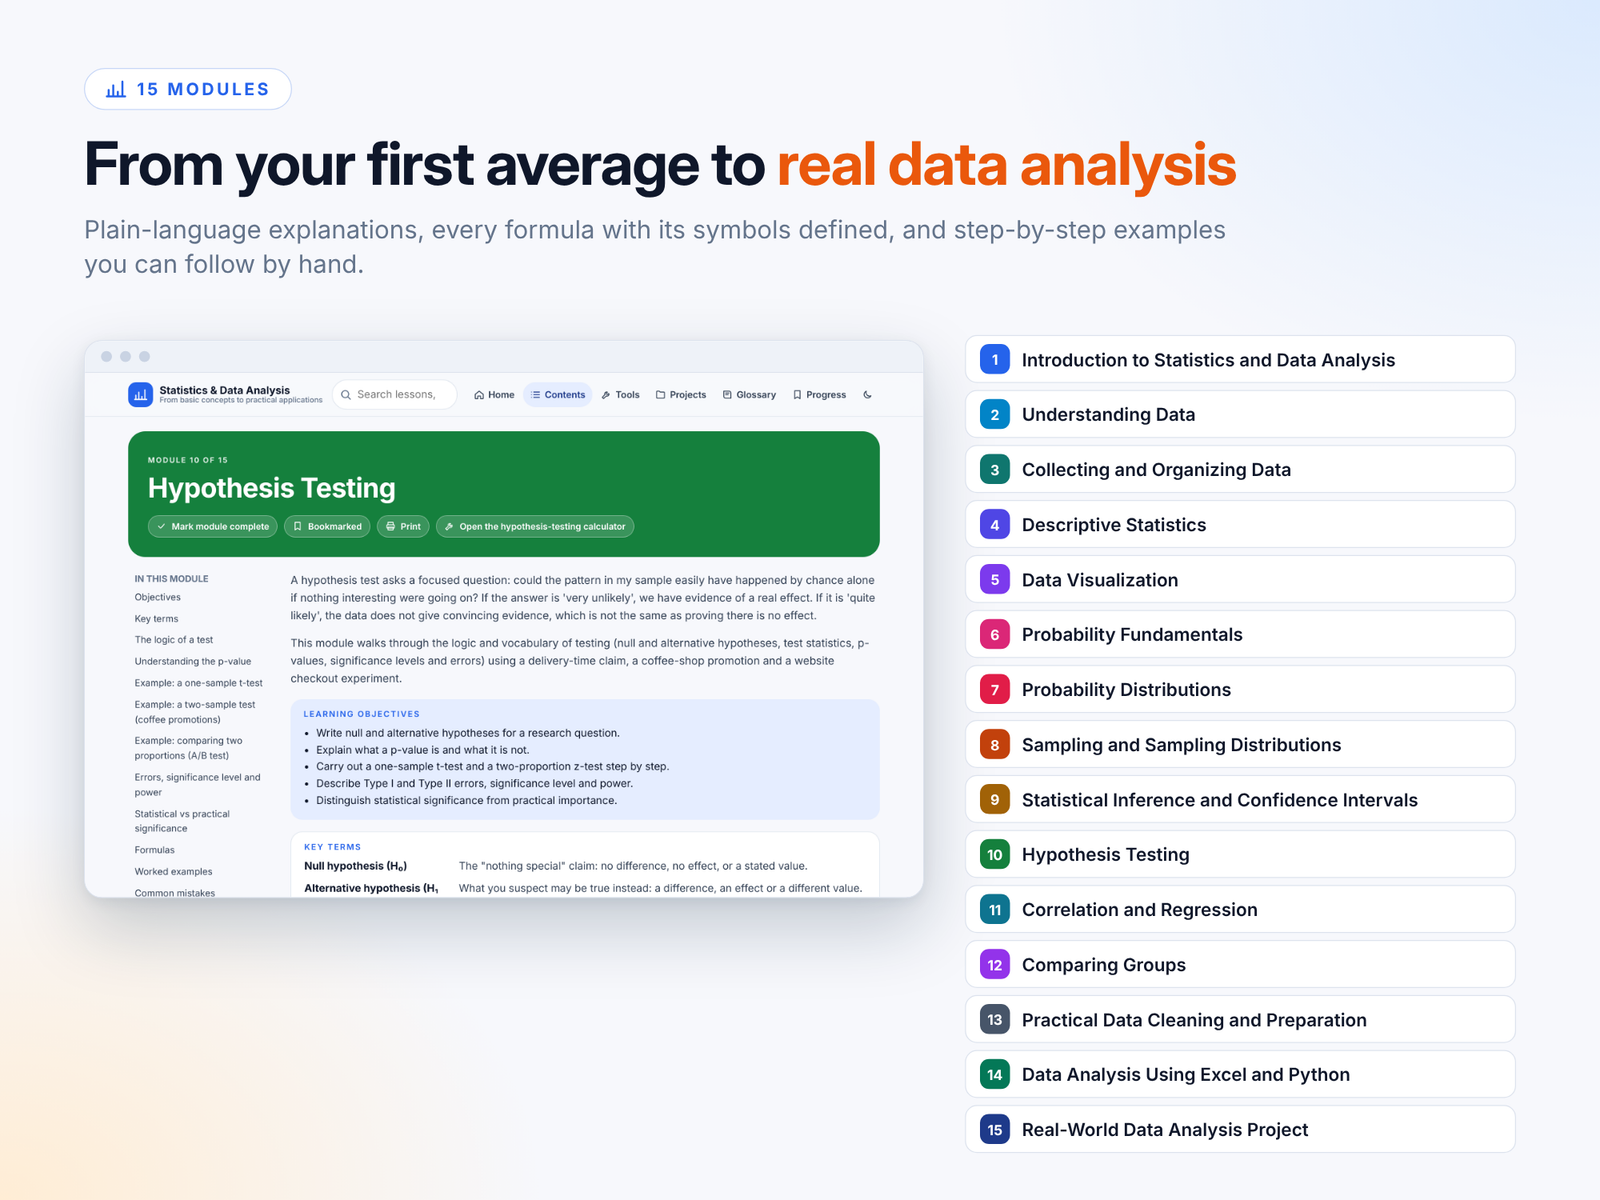
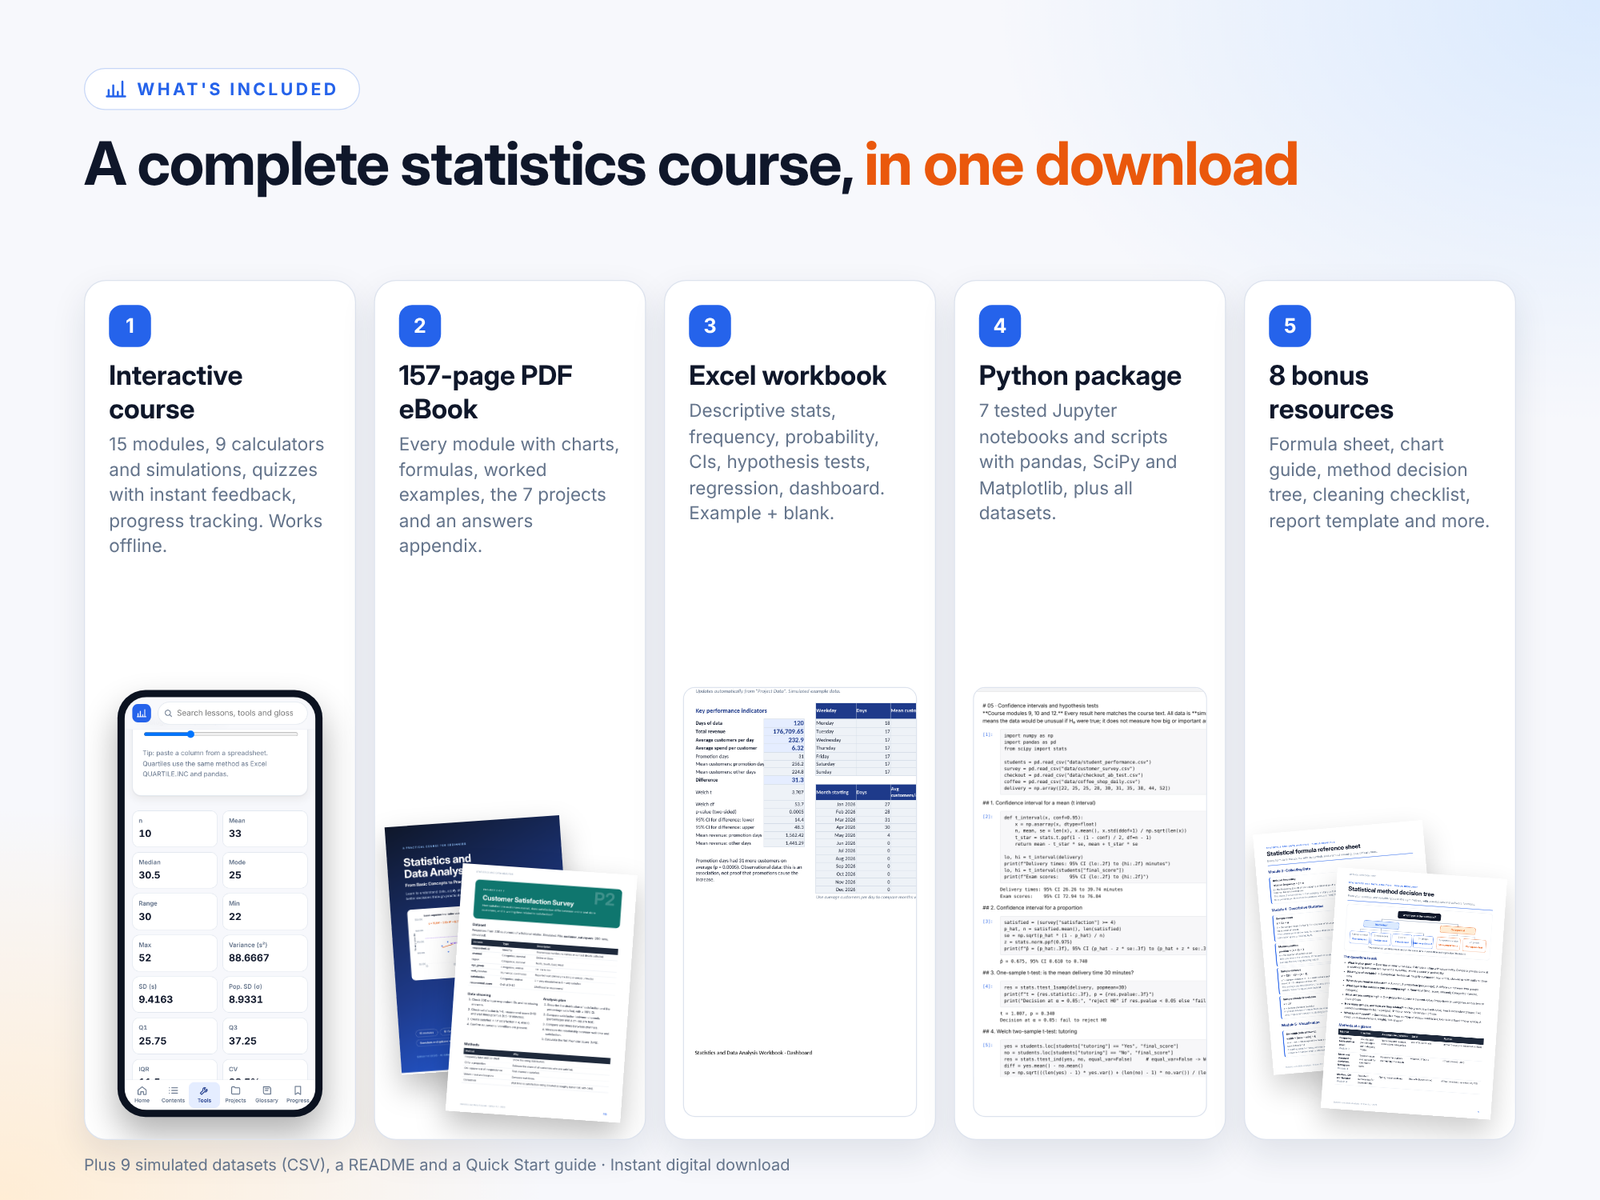
- Interactive HTML course: 15 modules, 90 quiz questions with instant feedback, 62 exercises with answers, progress tracking, bookmarks and a 158-term glossary. It works offline on desktop and mobile.
- 9 interactive tools:descriptive statistics calculator
- probability calculators
- confidence intervals, plus a simulation of what “95% confidence” really means
- central limit theorem simulator
- hypothesis-testing calculator covering 7 tests
- 8 graded testing exercises
- chart explorer
- regression visualiser
- “Choose the right statistical method” decision tool
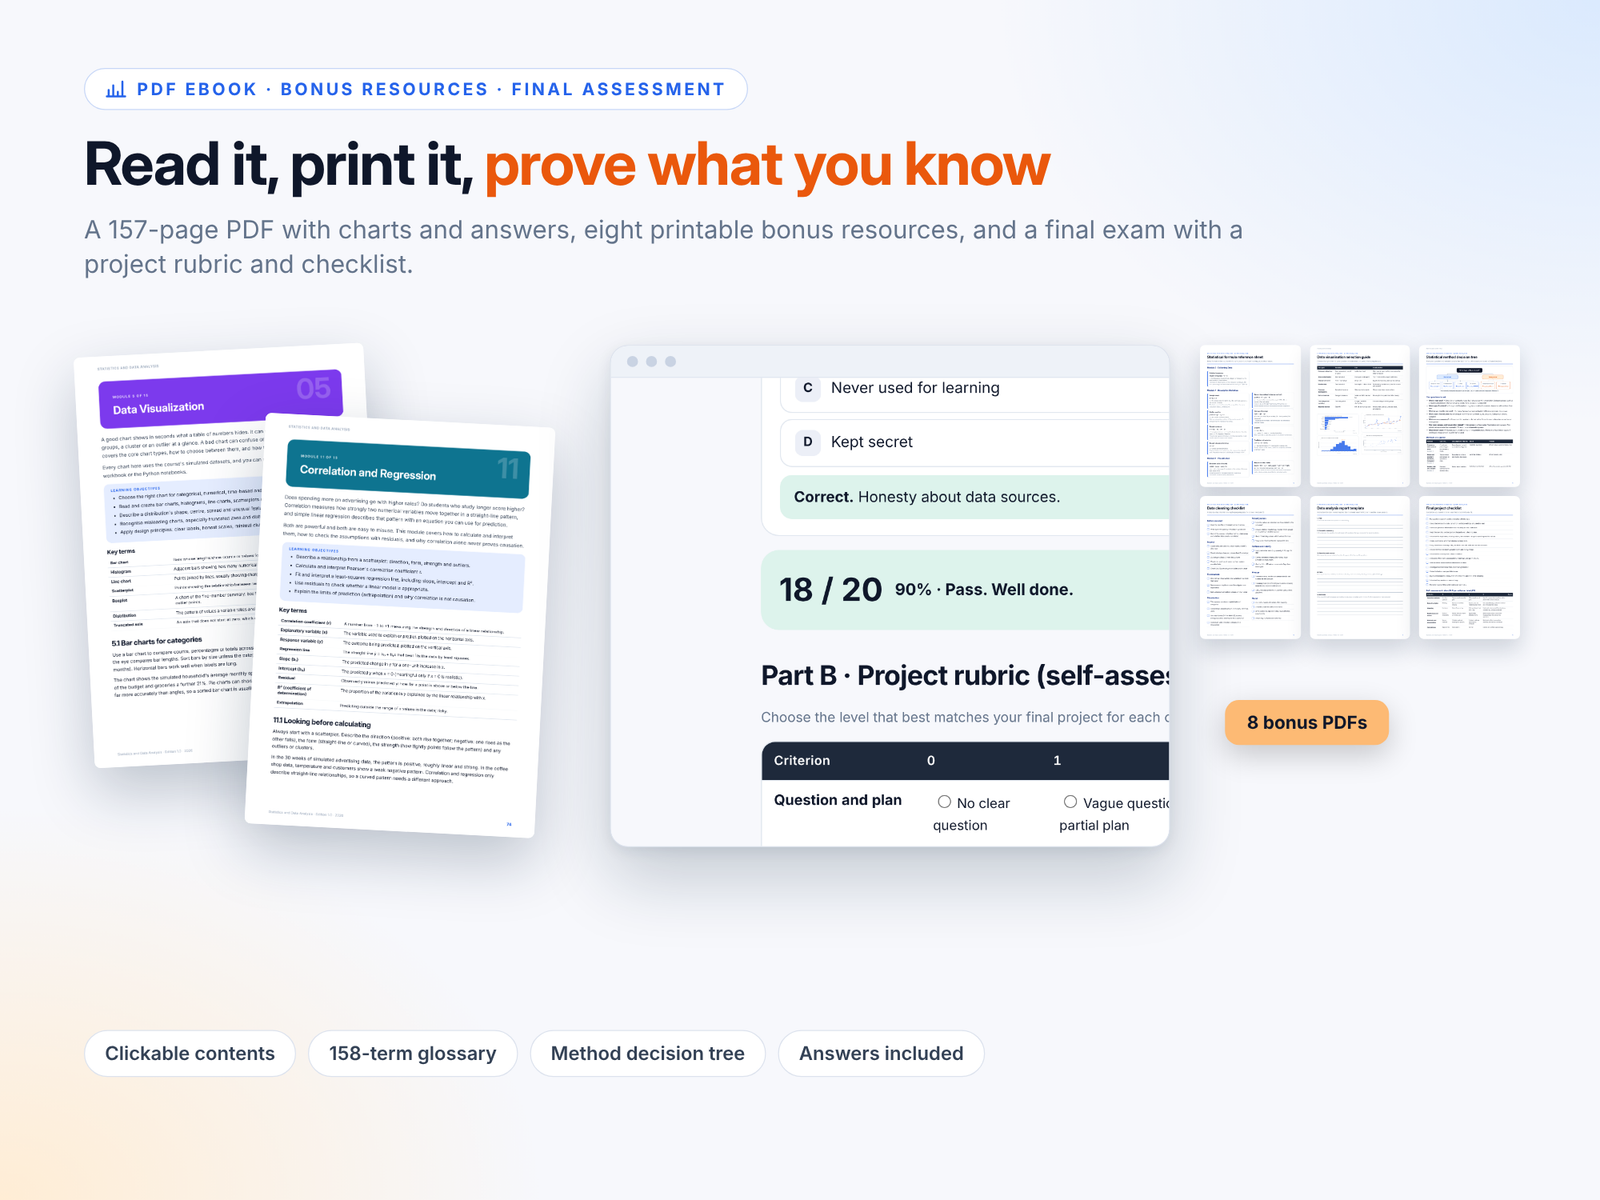
- 157-page PDF eBook: every module with charts, 51 formulas with every symbol explained, step-by-step worked examples, and an answers appendix.
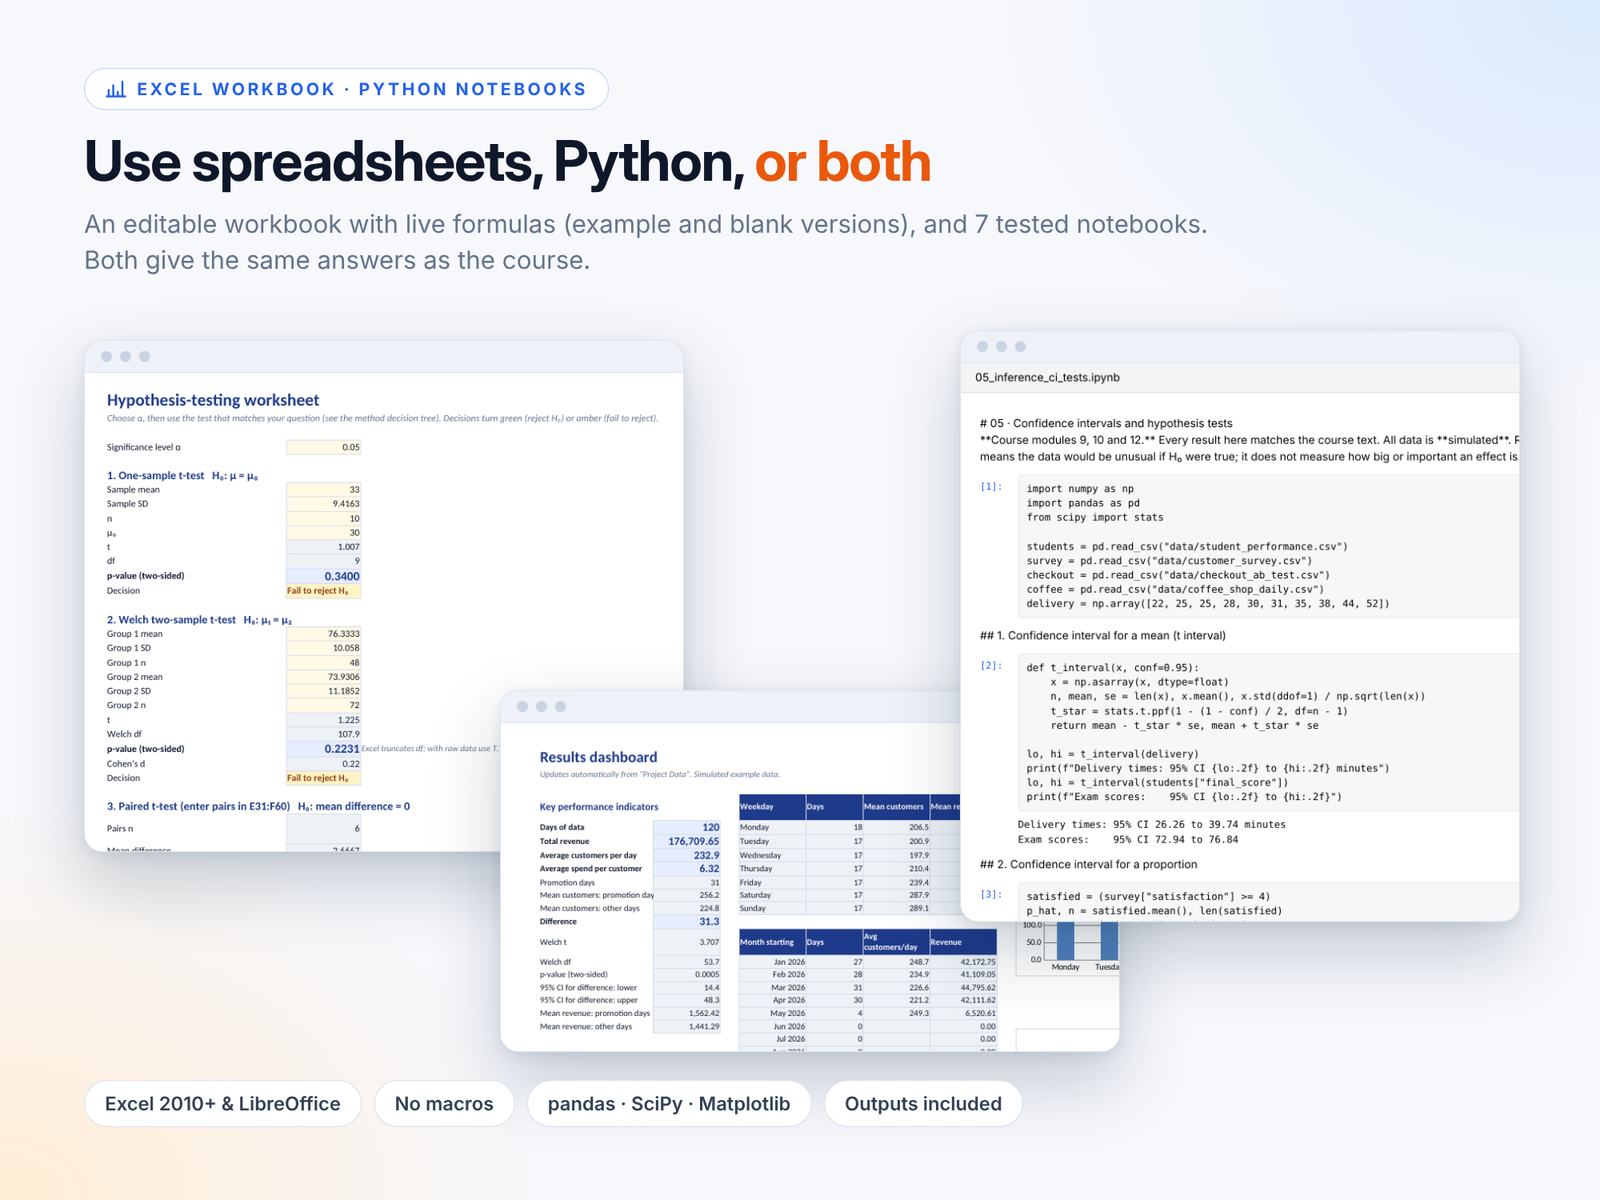
- Editable Excel workbook: example and blank versions. It covers data cleaning, descriptive statistics, frequency tables, probability, confidence intervals, hypothesis tests, regression, a project template and a dashboard. It uses live formulas and no macros.
- Python package: 7 tested Jupyter notebooks and scripts using pandas, SciPy and Matplotlib, with their outputs already included.
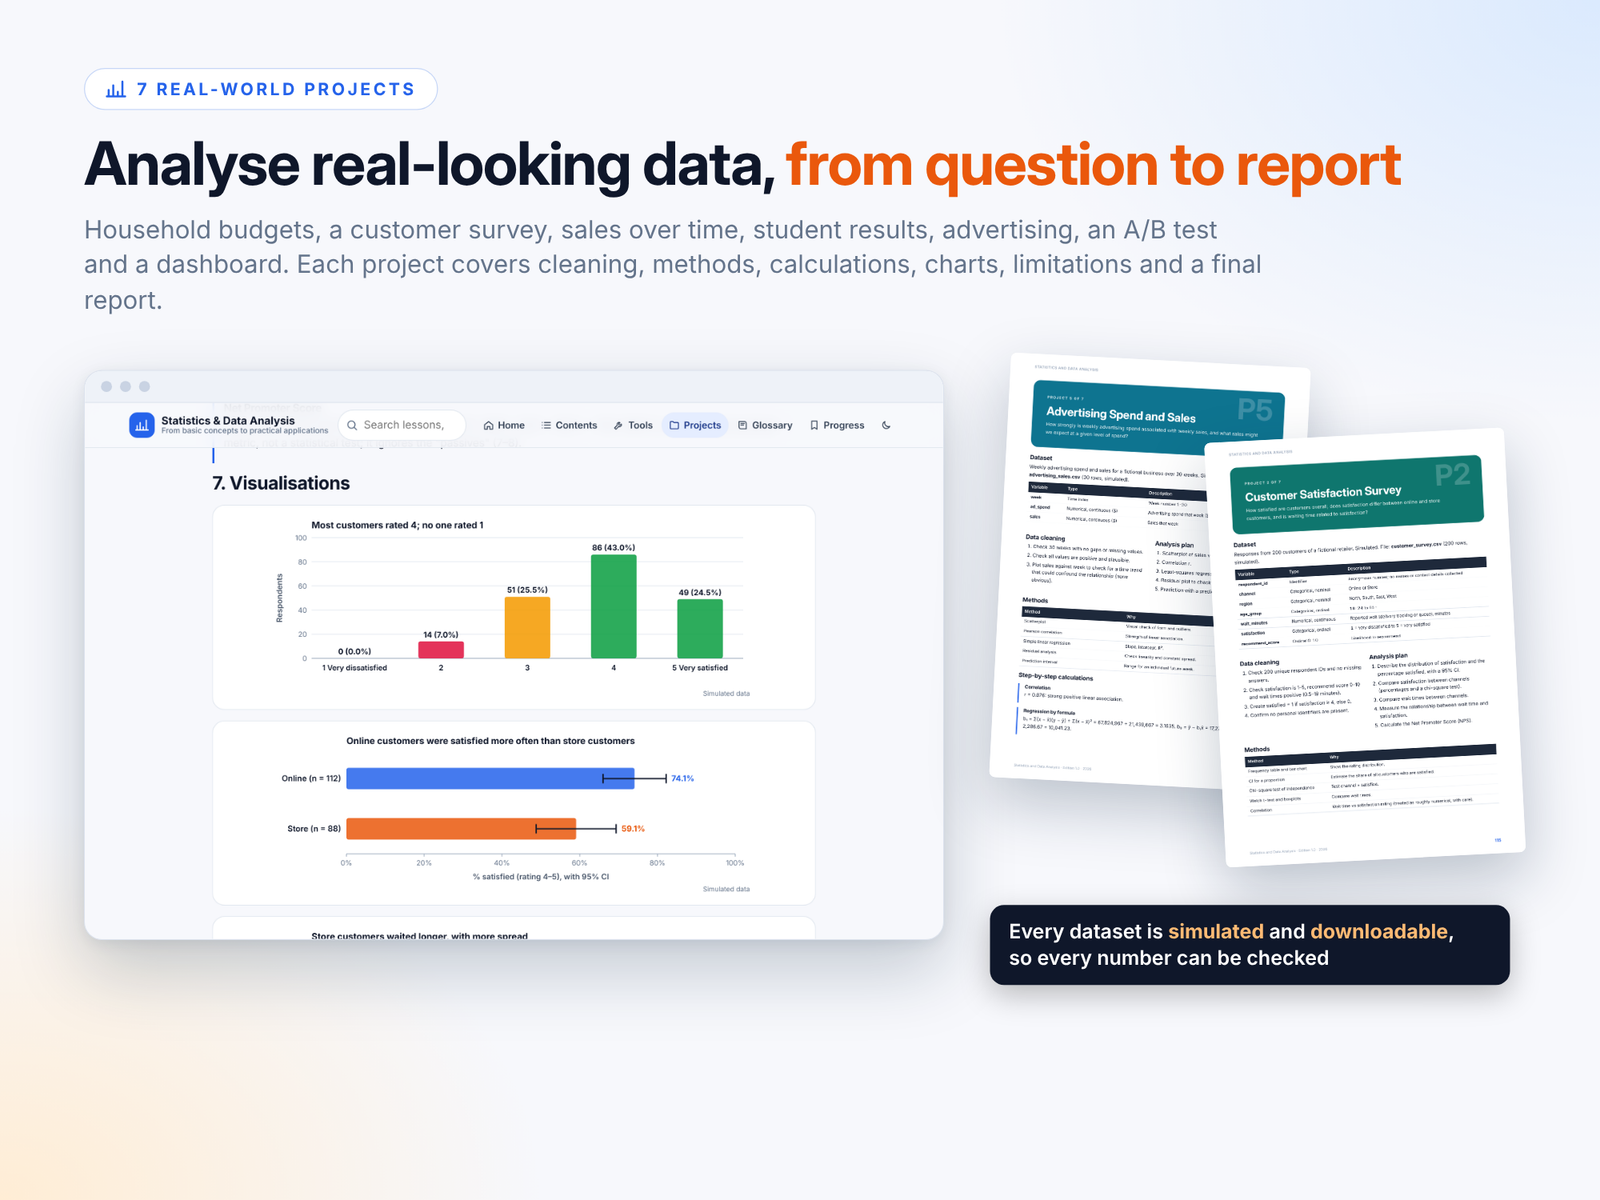
- 7 real-world projects: household spending, a customer survey, sales over time, student performance, advertising and sales, an A/B test, and a dashboard. Each one goes from question to final report.
- 8 printable bonus resources:formula sheet
- chart selection guide
- method decision tree
- data cleaning checklist
- report template
- dataset worksheet
- glossary
- final project checklist
What you’ll learn
- Mean, median, standard deviation and quartiles
- Charts that tell the truth, and how to spot misleading ones
- Probability, the normal and binomial distributions, and sampling
- Confidence intervals and p-values, interpreted correctly
- t-tests, chi-square tests, ANOVA, correlation and regression
- Data cleaning in Excel and Python
The course also explains:
- why correlation isn’t causation
- why “significant” doesn’t always mean important
- how to report results honestly
Good to know
- All datasets are simulated for teaching, so every number can be checked.
- This is an educational course. It is not a professional qualification.
- Instant digital download.

Reviews
There are no reviews yet.